Advanced Monitoring Configuration - Unicorn Analytic Service
Overview
Unicorn Analytic service allows the user to construct insights. An insight is a high-level analytic metric that is composed from raw metrics exposed by an application. The following is an example of an insight which calculates the cpu user utilization of every instance of a service called service-streaming
cpu_user_utilization =
   COMPUTE
      ARITHMETIC_MEAN( service-streaming:cpu_user, 60 SECONDS)
   EVERY 30 SECONDS
More specifically, the above insight specifies that every 30 seconds the system will calculate the last minute’s average utilization of all containers running the service-streaming.
Features
- Easy to define valuable, simple or complex analytic expressions
- Translate the user-defined expressions to distributed execution engine language (Spark Streaming)
- Feeds the generated results to elasticity policies service
Components
- Parser: Parses the raw insights and generates the abstruct model
- Compiler: Takes the abstruct model and generates the low-level commands and optimizations
- Manager: Coordinates the compilation phase and submits the generated artifact to destributed streaming engine
- Underline Streaming Engine: Is responsible for real-time execution, in the first release we support only
Spark
Architecture
Analytic Service supports users in composing analytic queries that are automatically translated and mapped to streaming operations suitable for running on distributed processing engines. This aids both advanced and inexperienced users to abstract and rigorously express complex analytics operations over streaming data, along with query constraints such as sample size and upper error-bounds for query execution to output approximate and in time answers. Thus, Analytic Service adopts a declarative programming paradigm, allowing users to describe analytic insights through a simple and powerful query modeling language.
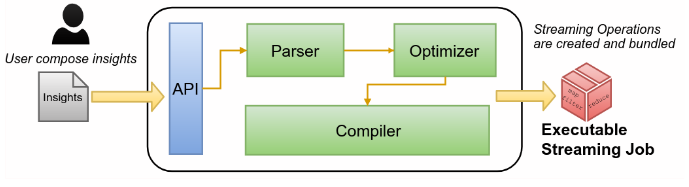
Previous image depicts a high-level and abstract overview of the Analytic Service compiler. Users submit ad-hoc queries following the declarative query model and the system compiles these queries into low-level streaming commands. After that the system, automatically, submits the executable artifact to the underline distributed engine, as the following picture shows.
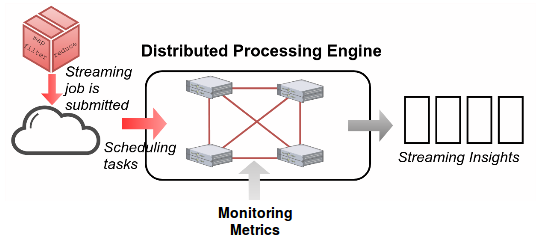
At the first version of analytic service, we integrated only the spark as underline destributed engine.
Constructing Insights
An insight is composed of 3 parts.
The COMPUTE part, allows the user to compose simple or complex
analytic expressions. The simple expressions can be either a window operation
or an accumulated operation.
The windowed operation takes as input metric streams from a time period and performs
an aggregation. For example: ARITHMETIC_MEAN( service:metric, 30 SECONDS).
On the other hand, an accumulated operation takes as input only the metric streams
of interest and computes the results based on previous results. For example:
RUNNING_MEAN(service:metric)
The EVERY part, specifies how often the calculations should occur (e.g., EVERY 30 SECONDS).
Finally, there is an optional part WITH, which allows the user to specify different
optimizations.
Available Operations
Windowed Operations
Windowed operations are used for aggregating values of interest in a time period in order to produce a summary statistic. Currently supported operations are:
- ARITHMETIC_MEAN
- SUM
- COUNT
- MIN
- MAX
- SDEV
- VARIANCE
- GEOMETRIC_MEAN
- MODE
- MEDIAN
- PERCENTILE[p]
- TOP_K [k]
Accumulated Operations
In contrast to windowed operations, these operations accumulate previous results in order to calculate the next result. Currently supported operations are:
- RUNNING_MEAN
- RUNNING_SDEV
- RUNNING_MAX
- RUNNING_MIN
- EWMA (Exponential Weighted Moving Average)
Insight Examples
Next, we will present some examples for useful insights from raw monitoring metrics.
EXAMPE 1
A useful insight that many companies need to monitor and take decisions on that is cpu utilization. So the following insight returns the average CPU utilization of a service for 30 seconds every 10 seconds.
cpu_utilization = COPMUTE (
        ARITHMETIC_MEAN( service:cpu_user, 30 SECONDS )
        + ARITHMETIC_MEAN( service:cpu_sys, 30 SECONDS )
) EVERY 10 SECONDS ;
EXAMPE 2
The free space in ram can be crucial for some applications, thus, the following expression gives us the RAM Average Usage for 10 minutes every 30 seconds.
ram_usage_per_service = COPMUTE
        ARITHMETIC_MEAN( service:ram , 10 MINUTES )
EVERY 30 SECONDS ;
EXAMPE 3
Next we present an insight for maximum number of HTTP Requests per Second for 10 minutes which computes every 30 seconds grouped by region. For devops and developers, who works on web-based applications, the peak of traffic in a specific region can be a critical factor.
http_requests_per_seconds_by_region = COPMUTE
        MAX( service:requests_per_seconds , 10 MINUTES ) BY Region
EVERY 30 SECONDS ;
EXAMPE 4
With the following example we can determine the difference between two serial time-windows (30 seconds) for user’s cpu usage. This insight will be computed every 10 seconds.
cpu_usage_diff = COPMUTE (
        ARITHMETIC_MEAN( service:cpu_user, 30 SECONDS )
        - ARITHMETIC_MEAN( service:cpu_user, 30 SECONDS, 30 SECONDS )
) EVERY 10 SECONDS ;
Insight Optimizations
The optimizations allow users to:
- Prioritize query execution over other queries so that when there is a high load influx, high priority queries are not delayed.
- Enforce query execution over a sample of the available measurements to output immediate results. For the latter, users can denote the exact sample size as a percentage from the available measurements the sampling technique must obey when constructing the sample.
Insight Prioritization
In the following example, the user defines two queries: cpu_utilization and ram_usage_per_service.
The cpu_utilization has salience 5 and ram_usage_per_service has salience 1. This means that, in high load influx, the cpu_utilization will be executed even 5 times more than ram_usage_per_service, thus the cpu_utilization will be more updated. If the query engine is stable, both queries will be executed as usual.
cpu_utilization = COPMUTE (
        ARITHMETIC_MEAN( service:cpu_user, 30 SECONDS )
        + ARITHMETIC_MEAN( service:cpu_sys, 30 SECONDS )
) EVERY 10 SECONDS WITH SALIENCE 5;

ram_usage_per_service = COPMUTE
        ARITHMETIC_MEAN( service:ram, 10 MINUTES )
EVERY 30 SECONDS WITH SALIENCE 1;
Sampling
In this example, the user wants to have a 25% sample of the query, so the system drops out the 25% from the input data.
cpu_utilization_sample = COPMUTE (
        ARITHMETIC_MEAN( service:cpu_user, 30 SECONDS )
        + ARITHMETIC_MEAN( service:cpu_sys, 30 SECONDS )
) EVERY 10 SECONDS WITH SAMPLE 0.25;
Complex Optimizations
Finally, we can have a compination of two these optimizations.
Next, we present an insight which SAMPLE 25% and SALIENCE 3.
COPMUTE (
        ARITHMETIC_MEAN( service:cpu_user, 30 SECONDS )
        + ARITHMETIC_MEAN( service:cpu_sys, 30 SECONDS )
) EVERY 10 SECONDS WITH SAMPLE 0.25 AND SALIENCE 3;
Reference
You can find a more detailed description of our system in the following paper:
“StreamSight: A Query-Driven Framework for Streaming Analytics in Edge Computing”, Z. Georgiou, M. Symeonides, D. Trihinas, G. Pallis, M. D. Dikaiakos, 11th IEEE/ACM International Conference on Utility and Cloud Computing (UCC 2018), Zurich, Switzerland, Dec 2018.