Advanced Monitoring Configuration - UNICORN Monitoring Service
Overview
Unicorn Monitoring Service is an open source monitoring system that follows an agent-based architecture that embraces the producer-consumer communication paradigm. The Unicorn Monitoring Service runs in a non-intrusive and transparent manner to any underlying cloud as neither the metric collection process nor metric distribution and storage are dependent to the underlying platform APIs and communication mechanisms.In turn, the Monitoring Service takes into consideration the rapid changes that occur due to the enforcement of elastic actions to the underlying infrastructure and the application topology.
Features
- Monitoring cloud and container level utilization
- Monitoring cloud application behavior and performance
- Metric collector development toolkit
- Access to historical and real-time monitoring metric data
- Runtime monitoring topology adaptation acknowledgement
- Monitoring rule language for metric composition, aggregation and grouping
- Code annotations
Components
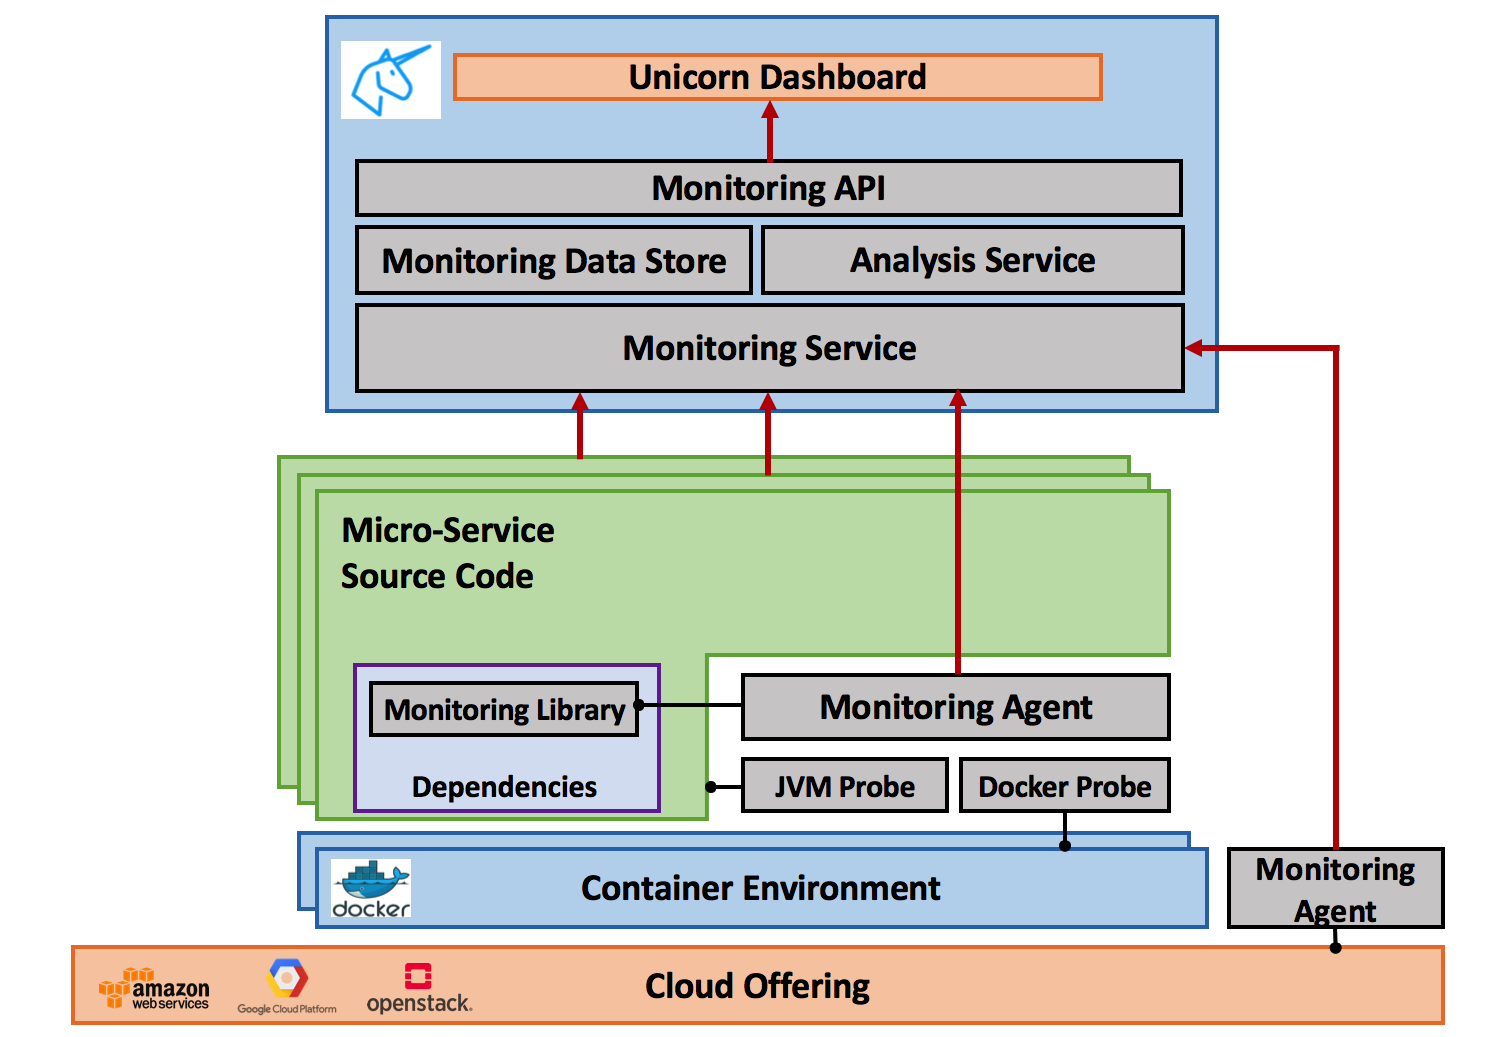
- Monitoring Agents: lightweight entities deployable on any cloud element to be monitored responsible for coordinating and managing the metric collection process on the respective cloud element (e.g., container, VM), which includes aggregation and dissemination of monitoring data to the Monitoring Service over a secure control plane.
- Monitoring Probes: the actual metric collectors that adhere to a common metric collection interface with specific Monitoring Probe implementations gathering metrics from the underlying infrastructure.
- Monitoring Library: the source code annotation design library supporting application instrumentation for Unicorn compliant cloud applications.
- Monitoring Service: the entity easing the management of the monitoring infrastructure by providing scalable and multi-tenant monitoring alongside the Unicorn platform.
- Monitoring Data Store: a distributed and scalable data store with a high-performance indexing scheme for storing and extracting monitoring updates.
- Monitoring REST API: the entity responsible for managing and authorizing access to monitoring data stored in the Monitoring Data Store.
Architecture
How to enable Unicorn Monitoring
Warning
Currently the Unicorn Monitoring can be enabled for JAVA Maven Projects
To enable the Unicorn Monitoring in your application you have to follow the simple steps below
- Step 1: Add the Catascopia Monitoring dependency to your
.pomfile
1 2 3 4 5 | <dependency>
<groupId>eu.unicornH2020.catascopia</groupId>
<artifactId>Catascopia-Agent</artifactId>
<version>0.0.3-SNAPSHOT</version>
</dependency>
|
- Step 2: Enable Catascopia Monitoring in your application either by code or annotation
An example SpringBoot DemoApplication should look like this:
1 2 3 4 5 6 7 8 | @SpringBootApplication
public class DemoApplication {
public static void main(String[] args) throws Exception {
SpringApplication.run(DemoApplication.class, args);
Catascopia agent = new Catascopia();
agent.startMonitoring();
}
}
|
or
1 2 3 4 5 6 7 8 9 | @SpringBootApplication
public class DemoApplication {
@UnicornCatascopiaMonitoring
public static void main(String[] args) throws Exception {
SpringApplication.run(DemoApplication.class, args);
}
}
|
At this point default monitoring is enabled and you will see monitoring data printed to your console.
- Step 3: For configuration, add a
catascopia.propertiesfile preferably under/src/main/resourcesand customize monitoring process
| Parameter Name | Default Value | Description |
|---|---|---|
| app.id | myapp | Application Id |
| agent.id | myservice | Agent Id |
| agent.logging | false | Enable logging |
| agent.aggregation | false | Enable metric aggregation with window set to service connector |
| service.connector | PrintRawStreamConnector | Other options: PrintAggregatedStreamConnector (print aggregated stream), NetdataConnector |
| probe.config | local | There are three different types of probes for Catascopia: local: these are the probes embedded in the probe library part of Catascopia Monitoring and basically monitor the underlying JVM, dependency:these probes are not part of Catascopia Monitoring but are added to the classpath through mvn dependencies, remote:these probes are added from remote sources |
Example of catascopia.properties
1 2 3 4 5 6 7 8 9 10 11 12 13 14 15 16 17 18 19 20 21 22 | ### Catascopia application monitoring config file###
#application id
app.id: myapp
#agent id
agent.id: myservice
#enable logging
agent.logging: true
#enable metric aggregation with window set to connector dissemination periodicity
agent.aggregation:true
#service connector configuration
service.connector: NetdataConnector
service.connector.ip: 127.0.0.1
service.connector.port: 8125
service.connector.rate: 10000
#catascopia probes configuration
probes.config:custom-probe,dependency:eu.unicornH2020.catascopia.probe,100
|
Unicorn Catascopia Monitoring Probes
Monitoring Probes are dynamically pluggable to Monitoring Agents via the Agent’s probe loader which embraces the class reflection paradigm to dynamically link, configure and instantiate Monitoring Probes at runtime in immutable execution environment.
In the Unicorn Monitoring Probe Repository there exists a number of publically available Monitoring Probes that can be used by users. To date, the Unicorn Monitoring Probe Repository hosts a JVM, J2EE and Docker Probe.
How to enable probes
- Step 1 : Add Catascopia Monitoring to your application as demonstrated above.
- Step 2 : Add the Maven dependency for the probe to your project’s
.pomfile
1 2 3 4 5 6 | <!-- example utilization of spring boot probe for catascopia monitoring -->
<dependency>
<groupId>eu.unicornH2020.catascopia</groupId>
<artifactId>SpringBootProbe</artifactId>
<version>0.0.1-SNAPSHOT</version>
</dependency>
|
- Step 3: Create a
probe.propertiesfile to alter the default probe configuration.
| Parameter Name | Default Value | Description |
|---|---|---|
| service.endpoint | http://localhost | Service Endpoint |
| service.port | 8080 | Service Port |
| service.headers | (empty) | if multiple headers will be appended then they must be delimited by “;” e.g., X-MY_CUSTOM_API_KEY:1234;X-ANOTHER_HEADER:3845fgd85930dkf |
- Step 4: In your application booter “import” the
CatascopiaMetricFilterandCatascopiaMetricProviderand start Catascopia
1 2 3 4 5 6 7 8 9 10 | @SpringBootApplication
@Import({CatascopiaMetricFilter.class, CatascopiaMetricProvider.class})
public class DemoApplication {
@UnicornCatascopiaMonitoring
public static void main(String[] args) throws Exception {
SpringApplication.run(DemoApplication.class, args);
}
}
|
How to develop custom probes
Nonetheless, Developers are free to create their own Monitoring Probes and Metrics, by adhering to the properties defined in the Monitoring Probe API which provides a common API interface and abstractions hiding the complexity of the underlying Probe functionality
The ExampleProbe below includes the definition of two SimpleMetric’s, denoted as Metric1 and Metric2, that periodically report random integer and double values respectively. In this code snippet we also observe that for a user to develop a Monitoring Probe, she must only provide default values for the Probe periodicity and a name, a short description of the offered functionality and a concrete implementation of the collect() method which, as denoted by the name, defines how metric values are updated.
1 2 3 4 5 6 7 8 9 10 11 12 13 14 15 16 17 18 19 20 21 22 23 24 25 26 27 28 29 30 31 32 33 34 35 36 37 38 39 40 41 42 43 44 45 46 47 48 49 50 51 52 53 54 55 56 57 58 59 60 61 62 63 64 65 66 67 68 69 70 71 72 73 74 75 76 77 | package eu.unicornH2020.catascopia.probe;
import java.util.Random;
import eu.unicornH2020.catascopia.probe.Probe;
import eu.unicornH2020.catascopia.probe.exceptions.CatascopiaMetricValueException;
import eu.unicornH2020.catascopia.probe.metricLibrary.CounterMetric;
import eu.unicornH2020.catascopia.probe.metricLibrary.SimpleMetric;
import eu.unicornH2020.catascopia.probe.metricLibrary.TimerMetric;
public class ExampleProbe extends Probe {
private static final int DEFAULT_SAMPLING_PERIOD = 10000;
private static final String DEFAULT_PROBE_NAME = "ExampleProbe";
private SimpleMetric<Double> metric1;
private SimpleMetric<Integer> metric2;
private CounterMetric metric4;
public ExampleProbe(String name, long period) {
super(name, period);
this.metric1 = new SimpleMetric<Double>("m1", "%", "an example of a random percentage", true, 0.0, 100.0);
this.metric2 = new SimpleMetric<Integer>("m2", "", "an example of a random integer", true, 0, 10);
this.metric4 = new CounterMetric("m4", "an example of a counter metric", 0, 10, 1);
this.addMetricToProbe(this.metric1);
this.addMetricToProbe(this.metric2);
this.addMetricToProbe(this.metric4);
}
public ExampleProbe() {
this(DEFAULT_PROBE_NAME, DEFAULT_SAMPLING_PERIOD);
}
@Override
public String getDescription() {
return "An exemplary probe showcasing the offered functionality";
}
@Override
public void collect() throws CatascopiaMetricValueException {
TimerMetric tmetric = new TimerMetric("tmetric", "an example of a timer metric", this.getPeriod());
this.addMetricToProbe(tmetric);
tmetric.start();
Random r = new Random();
this.metric1.setValue(r.nextDouble() * 100);
this.metric2.setValue(r.nextInt(10));
try {
this.metric4.increment();
}
catch(CatascopiaMetricValueException e) {
e.printStackTrace();
this.metric4.reset();
}
try {
Thread.sleep(r.nextInt(1000));
}
catch (InterruptedException e) {
e.printStackTrace();
}
tmetric.finished();
// System.out.println(this.toJSON());
}
public static void main(String[] args){
ExampleProbe p = new ExampleProbe();
p.activate();
}
}
|
Available Metrics Libraries
| Metric Class | Description |
|---|---|
| CounterMetric | Emits a cumulative metric that represents a monotonically increasing counter |
| SimpleMetric | Emits a value for a referenced metric periodically. |
| TimerMetric | Emits the time consumed for the completion of a referenced task (e.g., API call). |